
Cropland

Report Builder
This reporting is presented to allow downloads of pdf reports for selected parameters.
This is not intended to provide a narrative report.
Higher resolution images of each of the maps and charts is available from within the separate indicator pages by clicking on the images,
which are derived from FAO GIEWS.
Select the indicators you wish to see in the report by ticking the boxes below and they will appear on the page.
If you wish to print the report or save as a pdf then use the "Generate Report" button.
There is additional descriptive text available for each indicator. To view it, click on the title of the indicator of interest after having chosen it for the report
STRENGTHENING AFGHANISTAN INSTITUTIONS’ CAPACITY FOR THE ASSESSMENT OF AGRICULTURAL PRODUCTION AND SCENARIOS DEVELOPMENT GCP/AFG/087/EC
Crop Bulletin
Date
Dekad
The Agricultural Stress Index (ASI) is a quick-look indicator that facilitates the early identification of cropped land with a high likelihood of water stress (drought).
The Index is based on the integration of the Vegetation Health Index (VHI) in two dimensions that are critical in the assessment of a drought event in agriculture: temporal and spatial.
The first step of the ASI calculation is a temporal averaging of the VHI, assessing the intensity and duration of dry periods occurring during the crop cycle at the pixel level;
this calculation includes the use of crop coefficients, which introduces sensitivity of a crop to water stress during each phenological phase.
The second step determines the spatial extent of drought events by calculating the percentage of pixels in arable areas with a VHI value below 35 percent (this value was identified as a critical threshold in assessing the extent of drought in previous research by Kogan, 1995).
Each administrative area is classified according to the percentage of the affected area to facilitate the quick interpretation of results.

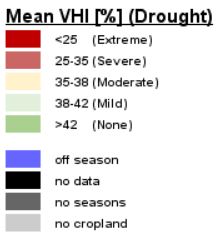
Agricultural droughts are classified by their intensity and are categorized into four classes: Extreme, Severe, Moderate or Mild.
The intensity of the drought is calculated through the Weighted Mean Vegetation Health Index aggregated per GAUL 2 region, indicating that the poorer the vegetation health the more severe the drought.

The Mean Vegetation Health Index (Mean VHI) allows the user to assess the severity of the drought from the start of the growing season, examining the vegetation health and the influence of temperature on plant conditions.
The Mean VHI is an average of the dekadal VHI values over the crop-growing season to date.
It takes into account the sensitivity of a crop to water stress over its growing season and calculates the temporal impact of moisture deficits since the start of the growing season until the current dekad.

The Normalized Difference Vegetation Index (NDVI) measures the "greenness" of ground cover and is used as a proxy to indicate the density and health of vegetation.
NDVI values range from +1 to -1, with high positive values corresponding to dense and healthy vegetation, and low and/or negative NDVI values indicating poor vegetation conditions or sparse vegetative cover.
The NDVI anomaly indicates the variation of the current dekad to the long-term average, where a positive value (for example 20 percent) would signify enhanced vegetation conditions compared to the average, while a negative value (for instance -40 percent) would indicate comparatively poor vegetation conditions.


The Vegetation Condition Index (VCI) evaluates the current vegetation health in comparison to the historical trends.
The VCI relates current dekadal Normalized Difference Vegetation Index (NDVI) to its long-term minimum and maximum, normalized by the historical range of NDVI values for the same dekad.
The VCI was designed to separate the weather-related component of the NDVI from the ecological element.

The Vegetation Health Index (VHI) illustrates the severity of drought based on the vegetation health and the influence of temperature on plant conditions.
The VHI is a composite index and the elementary indicator used to compute the ASI.
It combines both the Vegetation Condition Index (VCI) and the Temperature Condition Index (TCI).
The TCI is calculated using a similar equation to the VCI, but relates the current temperature to the long-term maximum and minimum , as it is assumed that higher temperatures tend to cause a deterioration in vegetation conditions.
A decrease in the VHI would, for example, indicate relatively poor vegetation conditions and warmer temperatures, signifying stressed vegetation conditions, and over a longer period would be indicative of drought. The VHI images are computed for the two main seasons and in three modalities: dekadal, monthly and annual.


The map depicts cumulative rainfall volumes over a dekad (a 10-day period). Precipitation estimates data is obtained from ECMWF.


The map illustrates the difference between the current rainfall volume and the average level.
Rainfall levels are compared with the Long-Term Average (LTA), which refers to the period 1989-2015.
Warmer colours identify areas which have received lower-than-average rainfall, while colder colours are given to areas where precipitation has been above average.


Acknowledgements
Data are provided by the GIEWS online system hosted by the FAO
Precipitation
ECMWF
NDVI
METOP
NOAA-AVHRR
Crop Mask
Global Land Cover - SHARE (GLC-SHARE)
| Agricultural Stress Index Season 1 - Grassland
(more ...)
(less ...)
The Agricultural Stress Index (ASI) is a quick-look indicator that facilitates the early identification of cropped land with a high likelihood of water stress (drought). The Index is based on the integration of the Vegetation Health Index (VHI) in two dimensions that are critical in the assessment of a drought event in agriculture: temporal and spatial. The first step of the ASI calculation is a temporal averaging of the VHI, assessing the intensity and duration of dry periods occurring during the crop cycle at the pixel level; this calculation includes the use of crop coefficients, which introduces sensitivity of a crop to water stress during each phenological phase. The second step determines the spatial extent of drought events by calculating the percentage of pixels in arable areas with a VHI value below 35 percent (this value was identified as a critical threshold in assessing the extent of drought in previous research by Kogan, 1995). Each administrative area is classified according to the percentage of the affected area to facilitate the quick interpretation of results. |
|
|
| Agricultural Stress Index Season 2 - Cropland
(more ...)
(less ...)
The Agricultural Stress Index (ASI) is a quick-look indicator that facilitates the early identification of cropped land with a high likelihood of water stress (drought). The Index is based on the integration of the Vegetation Health Index (VHI) in two dimensions that are critical in the assessment of a drought event in agriculture: temporal and spatial. The first step of the ASI calculation is a temporal averaging of the VHI, assessing the intensity and duration of dry periods occurring during the crop cycle at the pixel level; this calculation includes the use of crop coefficients, which introduces sensitivity of a crop to water stress during each phenological phase. The second step determines the spatial extent of drought events by calculating the percentage of pixels in arable areas with a VHI value below 35 percent (this value was identified as a critical threshold in assessing the extent of drought in previous research by Kogan, 1995). Each administrative area is classified according to the percentage of the affected area to facilitate the quick interpretation of results. |
|
|
| Agricultural Stress Index Season 2 - Grassland
(more ...)
(less ...)
The Agricultural Stress Index (ASI) is a quick-look indicator that facilitates the early identification of cropped land with a high likelihood of water stress (drought). The Index is based on the integration of the Vegetation Health Index (VHI) in two dimensions that are critical in the assessment of a drought event in agriculture: temporal and spatial. The first step of the ASI calculation is a temporal averaging of the VHI, assessing the intensity and duration of dry periods occurring during the crop cycle at the pixel level; this calculation includes the use of crop coefficients, which introduces sensitivity of a crop to water stress during each phenological phase. The second step determines the spatial extent of drought events by calculating the percentage of pixels in arable areas with a VHI value below 35 percent (this value was identified as a critical threshold in assessing the extent of drought in previous research by Kogan, 1995). Each administrative area is classified according to the percentage of the affected area to facilitate the quick interpretation of results. |

|
|
| Drought Intensity Season 1 - Cropland
(more ...)
(less ...)
Agricultural droughts are classified by their intensity and are categorized into four classes: Extreme, Severe, Moderate or Mild. The intensity of the drought is calculated through the Weighted Mean Vegetation Health Index aggregated per GAUL 2 region, indicating that the poorer the vegetation health the more severe the drought. |
|
|
| Drought Intensity Season 1 - Grassland
(more ...)
(less ...)
Agricultural droughts are classified by their intensity and are categorized into four classes: Extreme, Severe, Moderate or Mild. The intensity of the drought is calculated through the Weighted Mean Vegetation Health Index aggregated per GAUL 2 region, indicating that the poorer the vegetation health the more severe the drought. |
|
|
| Drought Intensity Season 2 - Cropland
(more ...)
(less ...)
Agricultural droughts are classified by their intensity and are categorized into four classes: Extreme, Severe, Moderate or Mild. The intensity of the drought is calculated through the Weighted Mean Vegetation Health Index aggregated per GAUL 2 region, indicating that the poorer the vegetation health the more severe the drought. |
|
|
| Drought Intensity Season 2 - Grassland
(more ...)
(less ...)
Agricultural droughts are classified by their intensity and are categorized into four classes: Extreme, Severe, Moderate or Mild. The intensity of the drought is calculated through the Weighted Mean Vegetation Health Index aggregated per GAUL 2 region, indicating that the poorer the vegetation health the more severe the drought. |
|
|
| Mean Vegetation Health Index Season 1 - Cropland
(more ...)
(less ...)
The Mean Vegetation Health Index (Mean VHI) allows the user to assess the severity of the drought from the start of the growing season, examining the vegetation health and the influence of temperature on plant conditions. The Mean VHI is an average of the dekadal VHI values over the crop-growing season to date. It takes into account the sensitivity of a crop to water stress over its growing season and calculates the temporal impact of moisture deficits since the start of the growing season until the current dekad. |

|
|
| Mean Vegetation Health Index Season 1 - Grassland
(more ...)
(less ...)
The Mean Vegetation Health Index (Mean VHI) allows the user to assess the severity of the drought from the start of the growing season, examining the vegetation health and the influence of temperature on plant conditions. The Mean VHI is an average of the dekadal VHI values over the crop-growing season to date. It takes into account the sensitivity of a crop to water stress over its growing season and calculates the temporal impact of moisture deficits since the start of the growing season until the current dekad. |
|
|
| Mean Vegetation Health Index Season 2 - Cropland
(more ...)
(less ...)
The Mean Vegetation Health Index (Mean VHI) allows the user to assess the severity of the drought from the start of the growing season, examining the vegetation health and the influence of temperature on plant conditions. The Mean VHI is an average of the dekadal VHI values over the crop-growing season to date. It takes into account the sensitivity of a crop to water stress over its growing season and calculates the temporal impact of moisture deficits since the start of the growing season until the current dekad. |
|
|
| Mean Vegetation Health Index Season 2 - Grassland
(more ...)
(less ...)
The Mean Vegetation Health Index (Mean VHI) allows the user to assess the severity of the drought from the start of the growing season, examining the vegetation health and the influence of temperature on plant conditions. The Mean VHI is an average of the dekadal VHI values over the crop-growing season to date. It takes into account the sensitivity of a crop to water stress over its growing season and calculates the temporal impact of moisture deficits since the start of the growing season until the current dekad. |
|
|
| NDVI Anomaly
(more ...)
(less ...)
The Normalized Difference Vegetation Index (NDVI) measures the "greenness" of ground cover and is used as a proxy to indicate the density and health of vegetation. NDVI values range from +1 to -1, with high positive values corresponding to dense and healthy vegetation, and low and/or negative NDVI values indicating poor vegetation conditions or sparse vegetative cover. The NDVI anomaly indicates the variation of the current dekad to the long-term average, where a positive value (for example 20 percent) would signify enhanced vegetation conditions compared to the average, while a negative value (for instance -40 percent) would indicate comparatively poor vegetation conditions. |
|
|
| Vegetation Condition Index
(more ...)
(less ...)
The Vegetation Condition Index (VCI) evaluates the current vegetation health in comparison to the historical trends. The VCI relates current dekadal Normalized Difference Vegetation Index (NDVI) to its long-term minimum and maximum, normalized by the historical range of NDVI values for the same dekad. The VCI was designed to separate the weather-related component of the NDVI from the ecological element. |
|
|
| Vegetation Health Index
(more ...)
(less ...)
The Vegetation Health Index (VHI) illustrates the severity of drought based on the vegetation health and the influence of temperature on plant conditions. The VHI is a composite index and the elementary indicator used to compute the ASI. It combines both the Vegetation Condition Index (VCI) and the Temperature Condition Index (TCI). The TCI is calculated using a similar equation to the VCI, but relates the current temperature to the long-term maximum and minimum , as it is assumed that higher temperatures tend to cause a deterioration in vegetation conditions. A decrease in the VHI would, for example, indicate relatively poor vegetation conditions and warmer temperatures, signifying stressed vegetation conditions, and over a longer period would be indicative of drought. The VHI images are computed for the two main seasons and in three modalities: dekadal, monthly and annual. |
|
|
| Estimated Precipitation
(more ...)
(less ...)
The map depicts cumulative rainfall volumes over a dekad (a 10-day period). Precipitation estimates data is obtained from ECMWF. |
|
|
| Estimated Precipitation Anomaly
(more ...)
(less ...)
The map illustrates the difference between the current rainfall volume and the average level. Rainfall levels are compared with the Long-Term Average (LTA), which refers to the period 1989-2015.Warmer colours identify areas which have received lower-than-average rainfall, while colder colours are given to areas where precipitation has been above average. |
|
|
| Estimated Precipitation |
|
|
| Estimated Accumulated Precipitation |
|